Inside a Waste-to-Energy Power Plant, the Turbine Is the Easy Part
A tonne of municipal solid waste lands on the tipping floor, and about 550 kilowatt-hours come off the export meter at the far end of the building. That's the EPA's average across the 75 US waste-to-energy plants, and it's the figure every brochure quotes. Yet it's nearly useless as a design target. The real output swings from under 400 to past 700 kWh a tonne, and almost all of that spread is fixed hours before any steam reaches the turbine.
I build the sensor stacks and the control-loop tuning that ride on these lines, so I'll say it the way I see it: a waste to energy power plant is a thermal process bolted onto a feedstock you don't get to choose. The turbine and the generator are the easy part. They're the most mature, best-instrumented, least surprising components in the chain. What decides your output sits upstream of them, in the bunker and on the grate, and in how honest your calorific-value estimate is on any given shift.
Here's the whole path a tonne's worth of energy takes, and where it bleeds out before you can sell any of it:
- Bunker: the waste gets blended, or it doesn't. A bad mix hands the grate a calorific-value step it can't track.
- Grate and furnace: combustion control. Air trim too lean or too rich, a drifting oxygen cell, the single biggest loss you can actually fix.
- Boiler: heat becomes steam, the temperature held down by chloride chemistry. This sets the efficiency ceiling for the whole plant.
- Turbine and generator: steam becomes electricity. Mature, reliable, rarely the thing that's broken.
- Export meter and switchyard: what you sell, and the one number in the building nobody can quietly fudge.
What comes off the meter, and who buys it
So start where the money is. At four cents a kWh, 550 kWh works out to twenty or thirty dollars of electricity revenue per tonne of waste, which is roughly what the EPA reports US plants earn. And that's it. For a merchant plant selling waste to electricity into a wholesale market, the power sale on its own won't service the debt.
The gate fee will. A plant gets paid to accept the waste, often more per tonne than the electricity it later exports, and that tipping fee is the line that underwrites construction. On every revenue model I've seen, the export meter is the smallest number on the page; capital recovery, the gate fee, and the metals pulled from bottom ash carry the rest. OWI's breakdown of waste-to-energy plant costs and revenue streams lays out that full stack.
How you actually sell the electricity comes down to two structures. You either sign a power purchase agreement with a utility or a corporate offtaker at a set price, or you run merchant and take the wholesale price hour by hour. Lenders want the PPA, because waste to energy power plant economics can't absorb price swings on the one revenue line that's already thin. There's a second wrinkle, too: only the biogenic share of the waste, the food, paper, wood and textiles, counts as renewable for credits and most clean-power accounting. The fossil fraction, mostly plastics, doesn't. Whether your output earns renewable energy from waste credits hinges on getting that biogenic percentage measured and verified, which we've worked through in detail in when energy from waste actually counts as clean power.
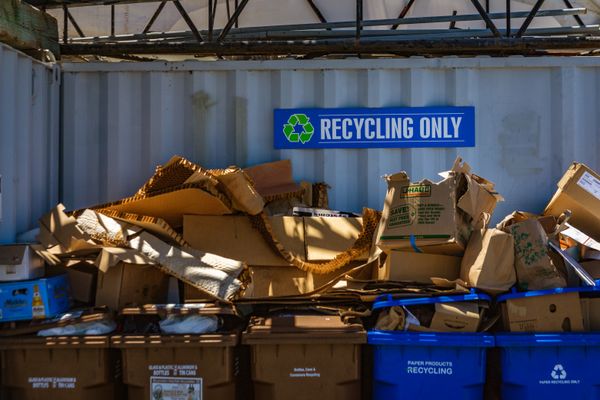
The bunker decides the number
Go back up the chain to where the output is really fixed. After the tipping hall, the waste drops into a deep concrete bunker, and an overhead grapple crane spends the entire day doing one underrated job: mixing. Wet kitchen waste in one corner, dry cardboard and plastic film in another, the calorific value of each grab swinging by a factor of two. The operator, or the automated crane on newer lines, blends those pockets into something the furnace can burn at a steady rate. Mix it badly and the grate sees a calorific-value step it can't follow, the steam flow lurches, and the megawatts wobble with it.
Storage? The bunker isn't storage. It's the homogenization stage, and it's the first place your output leaks. Moisture sits underneath all of it: MSW needs an annual average calorific value near 7 MJ/kg to burn without auxiliary fuel, and it shouldn't fall below 6 MJ/kg in any season, per the ScienceDirect work updating the old Tanner combustibility diagram. Every point of moisture you add eats into that, because the furnace burns heat boiling off water before it makes a single kWh of useful steam.
I've watched that exact mechanism wreck a model on the sorting side. In 2022 I ran an optical-sorter retrofit at a 600 TPD materials recovery facility, a Tomra autosort unit reading PET off a fast belt. Our commissioning logs had it at 94% recall on PET. Then a wet stretch pushed input moisture past 18%, and we logged recall collapsing to 71% inside a week, because wet flakes clump and surface film masks the near-infrared signature the sorter keys on. Same machine, same weights, same belt speed. Different feedstock. (Precision is easy; recall is where the model lies to you, and moisture is one of the fastest ways to make it lie.) A furnace is just a sorter for energy, and wet feedstock degrades its recall the same way.
The grate and the air-ratio loop
Most projects go wrong right here, and it's almost never the hardware. On a mass-burn line the waste travels down a moving grate, a Martin reciprocating design or one of its competitors, while primary air comes up through the bed and secondary air finishes the burn above it. The whole thing is a control problem: hold the bed at the right burnout, keep the furnace above roughly 850°C with a couple of seconds of gas residence, which the EU's incineration rules fix as the threshold for complete combustion, and keep the flue-gas oxygen inside a narrow band. Too little air gives you CO and unburned carbon; too much chills the furnace and throws heat up the stack.
That band is held by a control loop reading an oxygen sensor, and usually a CO sensor, in the flue gas, trimming grate speed and air dampers in real time. When a plant runs under nameplate, the cause is far more often a badly tuned loop or a drifting sensor than an undersized boiler. I'll put it the way I put it to vendors: tune the PID, not the model. Most of the gap between nameplate and reality on a waste to energy power plant is a few hundred hours of control-loop commissioning that nobody put in the budget.
And the sensors lie. Sensor drift always wins eventually; the only question is whether you catch it before the numbers do. An oxygen cell reading half a percent high will hold the loop lean for months, quietly bleeding steam, and the SCADA will show set point the entire time, because it's reporting the sensor, not the truth.
Why the steam stops at 400°C
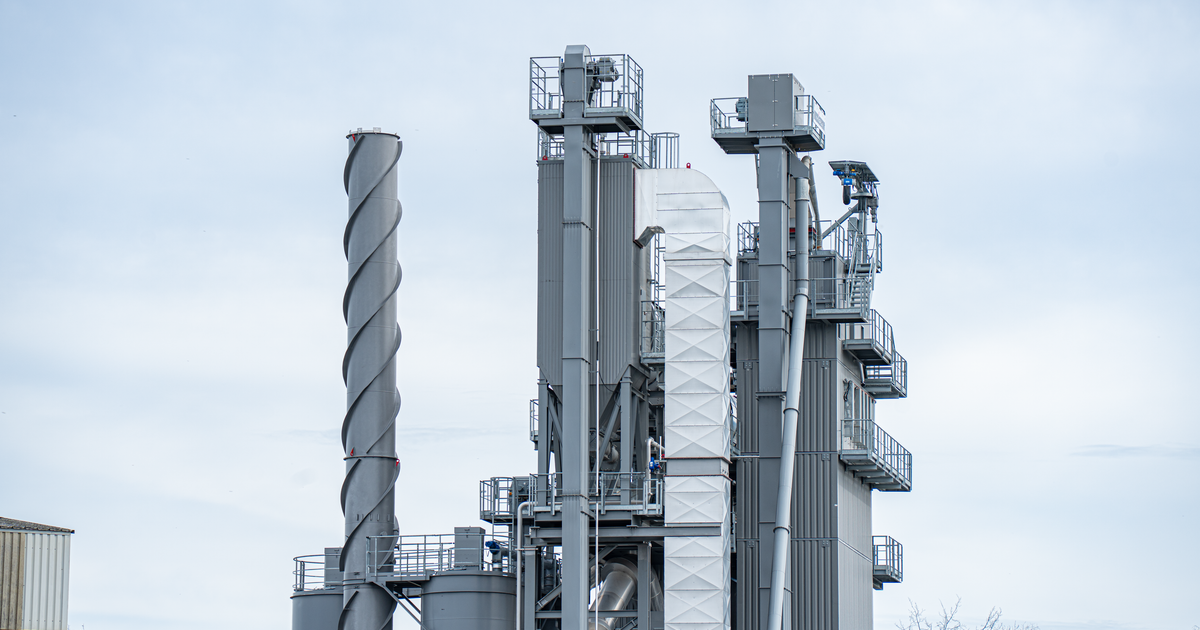
The boiler turns that heat into steam, and it's also where the plant's efficiency ceiling gets set, by chemistry you can't engineer around on the cheap. A coal plant superheats steam to 540-600°C chasing thermodynamic efficiency. A waste-to-energy boiler usually stops near 400°C and 40 bar (lower still if the chlorine load runs high). Why leave that efficiency on the table? Chlorine. Burn municipal waste and you release HCl and chloride salts from PVC, food and paper, and they deposit on the superheater tubes. Above roughly 450°C the chloride attack on the tube metal accelerates, and you start replacing boiler tubes faster than the extra efficiency is worth, a relationship documented across the WtE corrosion literature. So the design caps steam temperature deliberately, which holds net electrical efficiency near 20-25% for a mass-burn plant, well under what the same heat would make in a gas or coal cycle. Mass-burn is only one route inside the broader waste-to-energy technology family, but it's the one running most of the installed base.
Past the boiler, the rest is conventional power engineering. The flue gas still has to clear the cleanup train, the scrubber, baghouse and often SCR that 40 CFR Part 60 Subpart Eb requires of US municipal waste combustors, before it reaches the stack. The steam drives a turbine, the turbine spins a generator, a condenser drops the exhaust back to water, and a transformer steps the output up to grid voltage. None of it is exotic, and none of it is usually where your trouble lives. The components that look like the power plant, the turbine hall and the switchyard, are the ones you worry about least.
None of these numbers travel as well as the brochures imply. But the 550 kWh average is a dry-ish, decent-scale, Northern-Hemisphere figure. Below about 50 TPD the fixed cost of the flue-gas train and the steam cycle won't amortize, and small-plant heat losses drag efficiency down further. A plant in a wet tropical city with no district-heat customer to take its waste heat is fighting a calorific-value handicap and a missing revenue line at the same time. Don't design to 550 in Jakarta. For those sites the answer is often less about chasing kWh and more about pairing modest power export with broader zero-waste-to-landfill solutions that get paid on the disposal side.
Where the data layer earns its keep
So if the turbine is the easy part and the bunker and grate are the hard part, that's exactly where the sensor and vision work pays back. I spend most of my time building the calorific-value estimators and predictive-maintenance models that try to give the combustion loop a head start, reading the feed before it hits the grate instead of reacting after the steam has already moved (a few seconds of look-ahead is enough to matter). Done well, it shaves the variance the crane can't.
It pays off slower than the vendors promise. On a Hitachi Zosen line in 2024 I ran a predictive-maintenance pilot that fired 11 false positives before we traced them to labeling drift in the training data, not the model architecture. I tell people to halve any predictive-maintenance ROI claim for the first 18 months, because that's about how long it takes to clean the labels. The training set is the model; everything else is hyperparameters. And most "AI waste sorting" you'll be pitched is a rule-based pipeline with a CNN bolted on the front, which is worth knowing before you sign for it.
The failures are rarely where you look first, either. I lost six months in 2023 convinced a precision drop on a classifier was a model problem, retraining and re-weighting and second-guessing the architecture. It was the camera enclosure. Condensate from a poorly sealed gasket was fogging the lens on cold-morning starts, and the model had been fine the whole time. Sensor drift again, just wearing a different costume.
The export meter is the last fully honest number in the building. Everything upstream of it, the oxygen cell, the calorific-value estimate, the moisture reading off the bunker, is a measurement that drifts, and the whole job is catching the drift before the quarterly export figures do. The turbine never lies to you. Nothing else in the plant can say the same.
Sources & Notes
- The headline output and revenue numbers, 550 kWh a tonne, 75 US plants, and twenty to thirty dollars per tonne at four cents a kWh, come straight from the EPA's page on energy recovery from MSW combustion.
- On why the steam stays cool, this study of superheater corrosion in a waste-to-energy plant in ScienceDirect traces the chloride-deposit attack that caps tube-metal temperature.
- For an operator-side read on the same failure, Explosion Power's note on the four causes of superheater corrosion is plainer than the journals.
- The calorific-value floors near 7 MJ/kg annual and 6 MJ/kg seasonal, plus the moisture penalty, trace to the ScienceDirect update of the Tanner diagram on organic matter, moisture and heating value.
- The US emission limits behind the flue-gas cleanup train sit in 40 CFR Part 60 Subpart Eb for municipal waste combustors; the 850°C residence figure I cite is the European convention, not the US one.
Researched and written by OWI editorial staff. Technical review by RWE engineering. AI tools used for drafting assistance.