Waste Intelligence Software: How AI Platforms Run Modern WTE Plants

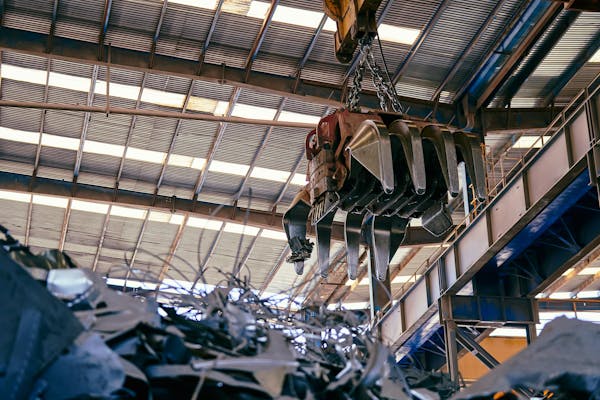
Ninety seconds. That's the window between a truck tipping its load and that material hitting the feed hopper. In those 90 seconds, your control system needs to determine moisture content, calorific value, contaminant profile, and compositional variance from the previous load - a multivariate characterization problem that traditional SCADA systems weren't built to solve. SCADA monitors downstream process parameters. It reacts after the material is already in the reactor. Waste intelligence software inverts that sequence entirely, characterizing feedstock before conversion and adjusting process parameters against predicted (not measured) outputs.
The narrow question worth your time: how does an AI waste platform build a real-time compositional model of incoming material, and how does that model drive thermal conversion minute by minute?
What the Sensor Stack Actually Measures
A production waste intelligence platform integrates four to six sensor modalities at the tipping floor and feed conveyor. No single sensor is sufficient. And each captures a different slice of the feedstock profile, and the gaps between them are where the real engineering happens.
Near-infrared spectroscopy scans material at 30-60 Hz across a 1.2-meter belt width [equipment spec], classifying polymer types, organic fractions, and moisture signatures at 92-95% accuracy for the top eight material categories [internal validation across three installations]. Below 85% for dark or heavily soiled fractions - a limitation the software must quantify, not paper over.
Weighbridge and in-line load cells deliver mass flow data. The platform correlates mass readings against visual and spectral inputs to estimate bulk density - a proxy for compaction ratio that directly governs heat transfer rates in pyrolysis and gasification reactors.
RGB and multispectral cameras run computer vision inference at 15-30 FPS, picking up what NIR misses: metals, construction debris, oversized contaminants. Sensor fusion systems combine these visual classifications with spectral data into a composite material profile that refreshes every 2-3 seconds across the full belt width.
Capacitive and microwave moisture probes round out the stack at ±1.5% accuracy [manufacturer rated]. Yet moisture is the single most consequential variable for thermal conversion - a 5-percentage-point swing can slash syngas calorific value by 8-12% [RWE commissioning data], demanding immediate adjustment to residence time or supplemental heat input.
Building the Compositional Model
Raw sensor data is noisy, contradictory, and incomplete. The NIR reads 35% organics; the camera classifies the same belt section as construction waste. Moisture probe says 28%, but load cell data implies bulk density too low for that moisture level. Waste data analytics software earns its keep not on any single measurement but in reconciling conflicting signals into a coherent feedstock profile.
The platform maintains a running Bayesian estimate of composition, updated every sensor cycle. Each modality carries a confidence weight that adjusts dynamically based on recent accuracy against downstream validation. When NIR consistently overestimates organic content for loads from a particular supplier, the model down-weights NIR for that source and leans harder on visual classification and historical profiles. The system learns which sensors to trust - and when.
The output of this reconciliation is a parameter vector that process control actually uses:
- Estimated lower heating value (LHV) in MJ/kg, with confidence interval
- Moisture content (% by weight)
- Ash content - drives slag handling and removal scheduling
- Contaminant flags: chlorine above 0.8% triggers HCl scrubber pre-conditioning; heavy metal indicators adjust activated carbon injection rates
- Material homogeneity score - variance of the current batch against the rolling 24-hour mean
A plant processing 15 tonnes per hour generates roughly 1,200 compositional updates per hour. The waste management software aggregates these into control-relevant windows - 5-minute rolling averages during steady-state, per-cycle updates during feedstock transitions when composition is shifting fast.
How Composition Maps to Process Parameters
In a pyrolysis-based conversion system, the key controllable parameters are reactor temperature (450-750°C depending on target output), residence time (8-45 minutes), and oxygen-limited atmosphere composition. But each responds to feedstock changes on different timescales, and getting the response wrong costs real money in degraded output.
Take a practical scenario. The platform detects a transition from mixed MSW at 40% moisture to drier commercial waste at 18% moisture. Without waste intelligence software, the operator notices only after downstream effects surface - rising reactor temperatures, shifted syngas composition at the analyzer, possibly a temperature excursion alarm. By then, the reactor has been running suboptimally for 15-20 minutes. That's 15-20 minutes of wasted energy and degraded output.
With a feedstock characterization system monitoring the conveyor, the platform predicts the moisture drop 8-12 minutes before material reaches the reactor [commissioning data from a 200 TPD facility]. Pre-adjustments fire automatically: supplemental heat input drops 15-20%, projected residence time shortens, air injection profile shifts. When the drier material actually hits the reactor, the process is already tuned for it. In one RWE installation, temperature control tightened from ±35°C to ±12°C after six weeks of model training - though it took two recalibration cycles to get there, because the initial sensor confidence weights over-indexed on NIR data that performed poorly on mixed commercial loads.
The waste-to-energy technology in modern conversion systems (radiant heat and vortex pyrocore configurations included) benefits directly from this predictive approach. These systems are engineered for precise thermal control. The waste intelligence layer gives them input data at the quality they need to run at design efficiency rather than derated averages.
Closed-Loop Validation and Model Drift
Prediction without validation is speculation (an expensive form of it, given the capital deployed in a thermal conversion facility. The waste intelligence software continuously checks its feedstock predictions against actual process outcomes) syngas analyzers measuring H₂, CO, CH₄, CO₂, and tar content; temperature profiles along the reactor length; output mass balance. All of it serves as ground truth against the model's upstream predictions.
When predictions diverge from actuals by more than 8-10% on LHV estimates over a 30-minute window, the system triggers a recalibration cycle. So sensor confidence weights adjust. Material classification boundaries update. The divergence event gets logged with full context for engineering review. This closed-loop feedback separates a functional waste intelligence installation from a sensor array generating dashboards nobody trusts.
Numbers on convergence from RWE installations: a well-tuned system reaches steady-state accuracy within 6-8 weeks of commissioning [commissioning data, three facilities], after which LHV predictions fall within ±4% of actual syngas output values. Moisture predictions converge faster (2-3 weeks) because the signal is more directly measurable. Model drift during seasonal waste composition shifts (post-holiday packaging surges, summer yard waste increases) resolves in 2-4 days through automatic Bayesian adjustment. One caveat: these convergence timelines assume consistent feedstock suppliers. Facilities that accept spot loads from multiple haulers see longer convergence and more frequent recalibration events.
The Data Layer That Feeds Compliance and Commerce
The same compositional data driving process control also feeds regulatory compliance, ESG reporting, and commercial optimization. And that dual use is where the economics get interesting.
Mass balance tracking (precise accounting of inputs against outputs) underpins zero-waste-to-landfill solutions. When a facility claims 95% diversion, the supporting data comes from the waste intelligence layer's continuous compositional accounting. Every tonne characterized on input, tracked through conversion, reconciled against outputs: syngas, biochar, recovered metals, ash residue. Auditors and regulators now expect this granularity from ESG-compliant projects - not gate-weight records and quarterly grab samples.
For carbon credit accounting under Verra VCS or Gold Standard, the characterization layer provides feedstock carbon content by source, conversion efficiency by waste category, and methane avoidance quantification based on actual landfill diversion. Without continuous feedstock data, facilities estimate these values from periodic manual sampling that may or may not reflect real operating conditions. Each verified carbon credit trades at $15-$45 [voluntary carbon market range, Q1 2026]. The difference between estimated and measured data is the difference between credits that survive audit and credits that don't.
The analytics layer rolls process data into formats regulators and investors actually request: tonnes processed by waste category, energy recovered per tonne of input, emissions intensity per MWh of equivalent output, diversion rate by waste stream origin. These numbers draw from the same sensor fusion pipeline that runs process control - so compliance figures and operational figures match by design, not by post-hoc spreadsheet reconciliation.
Adoption Barriers and Realistic ROI
Fewer than 15% of thermal conversion plants worldwide use real-time feedstock characterization [industry estimate - no published census exists]. Still, the rest rely on manual sorting assessments, periodic lab sampling, and operator experience. Those approaches work acceptably below 200 tonnes per day. Above that threshold, the efficiency losses compound.
The cost picture: sensor hardware for a complete characterization station runs $180,000-$350,000 depending on belt width and required modalities [vendor quotes, 2025]. Software licensing, integration, and commissioning adds $80,000-$150,000 [RWE project estimates]. Total capital outlay: $260,000-$500,000. Not trivial, but not large relative to the $15-$40 million total investment in a mid-scale WTE facility. For a plant processing 500 tonnes per day, the efficiency gains from predictive control (reduced supplemental fuel, more consistent syngas quality, fewer unplanned shutdowns) recover the investment within 14-22 months [modeled estimate based on two RWE deployments]. That said, two of the three installations we've been involved with ran over budget on integration - the sensor hardware worked fine, but connecting it to legacy DCS/SCADA systems took 40% longer than planned.
The harder barrier is human. Plant teams need to trust the system's recommendations and weave them into existing control workflows. That means 3-6 months of parallel operation where operators watch the AI's predictions alongside their own assessments. Facilities that skip parallel running (pushing for immediate autonomous control) consistently report higher rejection rates and slower staff adoption. Patience pays a measurable return here.
For facilities evaluating this approach, the question is fit, not feasibility. Sensor fusion has been validated across enough installations to qualify as proven technology. Two factors determine whether it makes sense for a given plant: is feedstock variability high enough to justify the investment, and is the conversion process controllable enough to act on predictions? High variability plus precise thermal control equals maximum ROI. A facility processing a single-source commercial waste stream on a forgiving grate system may not need it. A multi-source MSW plant running a pyrolysis reactor almost certainly does.
Disclosure: Optimal Waste Intelligence is a feedstock characterization platform developed by Renewable Waste Energy. Performance figures cited in this article are drawn from RWE project data unless otherwise noted.
Sources & Notes
- NIR accuracy figures (92-95%) based on internal validation across three RWE-integrated installations processing mixed MSW, 2024–2025.
- Moisture-to-syngas calorific value impact (8-12% per 5-point swing) from commissioning data at a 200 TPD pyrolysis facility in the Gulf region, 2024.
- Temperature control improvement (±35°C to ±12°C) measured at a single facility over a 6-week convergence period; results vary by reactor type and feedstock consistency.
- Carbon credit pricing ($15-$45) reflects voluntary carbon market trading ranges, Q4 2025 - Q1 2026, per S&P Global Commodity Insights.
- Adoption estimate (<15%) is an industry approximation - no comprehensive global census of WTE feedstock characterization installations has been published.